The other day, I was sitting with my niece, and she asked, “Why do these bars look like buildings?” She was looking at her very first bar graph. And honestly, that question made me smile. Because yes—when you think about it—bar graphs do look like little buildings, each one telling a story with its height.
That’s exactly why I created these bar graph worksheets for kids—to make learning simple, fun, and hands-on.
Download Your Free Bar Graph Worksheets (PDF)
If you’re a parent, teacher, or homeschooler, you can download the worksheets right here and start using them today.
- These worksheets include:
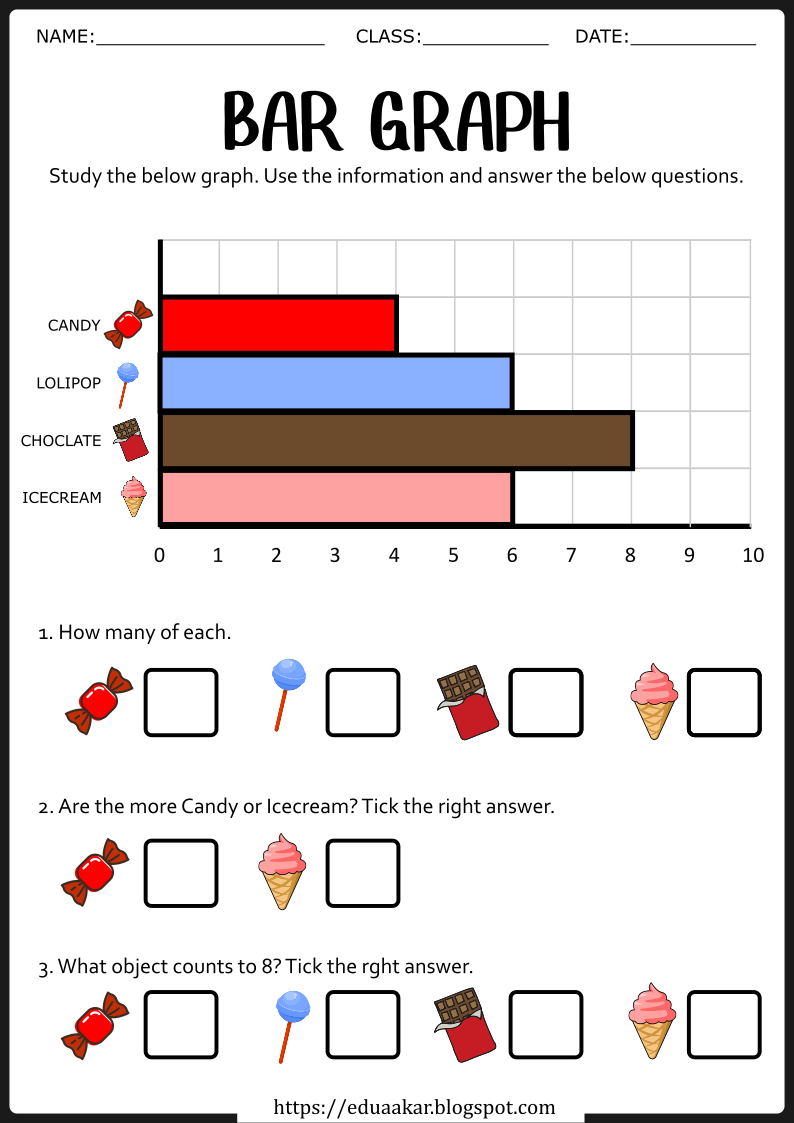
- Answering questions based on a bar graph
- Counting items represented on a bar graph
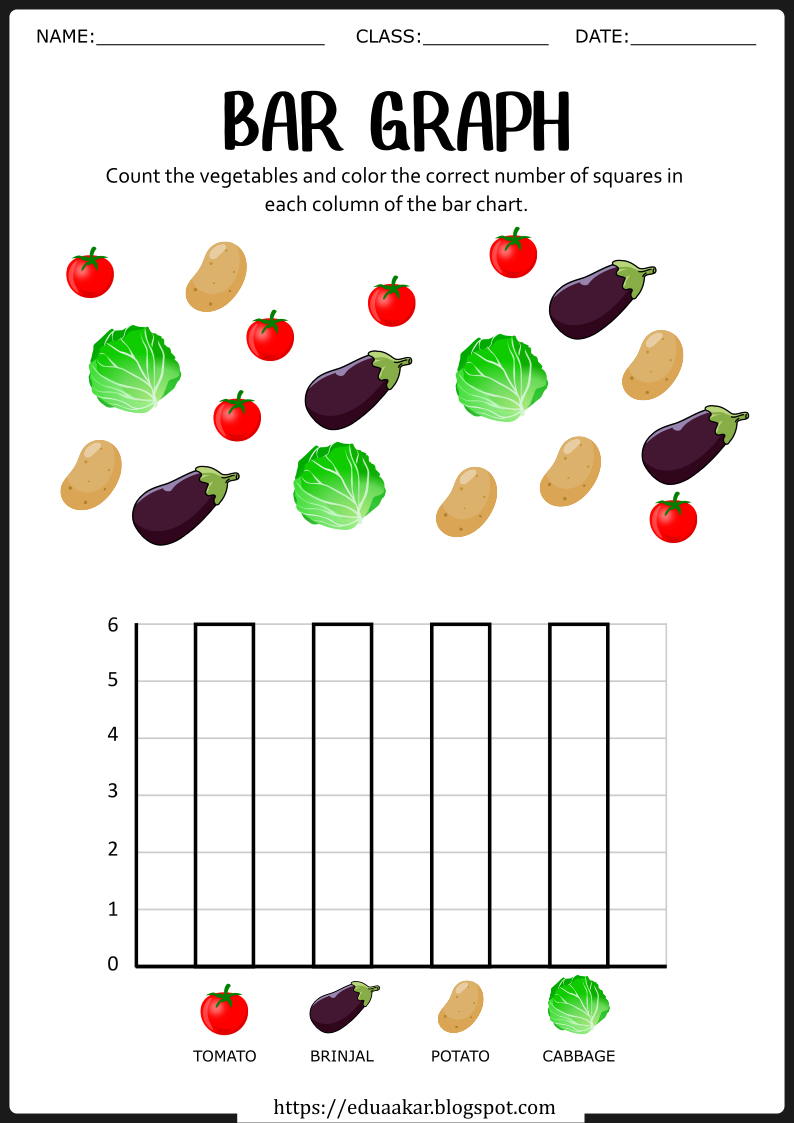
- Counting and coloring a bar graph from scratch
Perfect for visual learners, early math explorers, and kids who love to color while they learn.
Why Teach Bar Graphs to Kids?
Kids are naturally curious. They love to ask questions like “What’s the most?” or “How many?” That’s what makes bar graphs such a perfect concept for young learners.
Bar graphs help kids:
- Understand quantities in a visual way
- Compare information easily
- Begin analyzing simple data
- Build math confidence through real-life connections
And let’s be honest—show a child a colorful bar graph, and they’re already halfway engaged.
What’s Inside the Worksheets?
Here’s a quick peek into what each worksheet is designed to do:
1. Answering Questions from a Bar Graph
Kids read a completed bar graph and answer simple questions like:
- “Which category has the most?”
- “How many apples were sold?” It’s great for practicing observation and data interpretation.
2. Counting Items on a Bar Graph
3. Counting Objects and Coloring the Graph
Tips to Use These Worksheets at Home or in the Classroom
These worksheets are flexible—use them during math time or as part of your daily routine. Here are a few tips:
- Let them guess first. Before jumping into explanations, ask your child what they think the graph shows.
- Talk through each step. Ask questions like “What do you notice?” or “Which one is tallest?”
- Turn it into a game. Use a timer or turn the worksheet into a mini competition between siblings or classmates.
Try These Simple Bar Graph Activities Too
- Favorite fruit survey: Ask family members what fruit they like, tally the results, and draw a bar graph.
- Toy graphing: Group Legos, cars, or dolls by color or size, then chart the results.
- Weather tracker: Record sunny, cloudy, and rainy days on a homemade bar graph each week.


